Method note · Lab for Oxidation–Reduction Chemistry of Anoxic Microsites · SLAC
Continuous-flow anoxic incubation of intact soil cores on a LI-COR LI-8250
How we turned a stock LI-COR LI-8250 flask multiplexer into a continuous-flow anoxic incubator for intact soil cores, and what each forced design choice cost us.
Edward Turk · SLAC National Accelerator Laboratory · Incubation run 30 March – 3 April 2026
Contents
- Three requirements: intact core, imposed anoxia, continuous readoutWhat the core, the gas supply, and the analyzer each had to provide.
- The instrument: LI-8250 multiplexer, LI-7810 analyzer, and the flask sampling kitWhat the stock system does before any modification, including the observation and purge phases.
- Why a glove bag was unsuitable for incubationWhy an N₂-filled enclosure could not host the running analyzer and the open purge loop.
- Replacing the purge pump with a mixed-gas cylinderRemoving the pump and driving the purge line from a regulated N₂-based cylinder.
- Flow split and headspace turnover across eight jarsSetting 0.5 L min⁻¹ across eight jars, and holding each jar above ambient pressure.
- Delivery-tube placement and dry-mass correctionRouting gas to the jar rear, and rescaling flux from a placeholder mass to oven-dry mass.
- Leak testing and methane tracer recoveryThe leak checks used, the tracer recovery, and how sampling and diffusion losses were separated.
- Field methane sinks became sources under imposed anoxiaHow the four cores changed flux direction, and the field-versus-incubation comparison table.
- Limits of the methodRun length, gas use, core drying, single-point temperature, and per-jar seal variation.
- Equipment and operating settingsThe instruments, hardware, and configured parameters needed to reproduce the run.
The problem
Three requirements: intact core, imposed anoxia, continuous readout
Floodplain soils that are oxic in the bulk still emit methane, because methanogenesis proceeds inside anoxic microsites: millimetre-scale pockets held reduced by local carbon supply and restricted diffusion. The wider project pairs synchrotron µ-XRF and XAS mapping of iron redox state, used to determine the microsite activity of each soil core, with the methane flux of the same core when incubated using the method described here.
The incubation had three requirements. First, it had to be run on one half of an intact soil core, because the other half was being imaged on the beamline and any disturbance to the soil would affect its microsite activity. Second, the cores had to be kept under imposed anoxia, both during preparation and throughout the incubation itself. Last, the incubation had to be continuous-flow: the jar (flask) headspace was flushed continually with gas so that methane and carbon dioxide from the soil would not build up. The run also needed to last several days, to give the samples time to thaw and to record stable readings.
These conditions shaped how the experiment was executed, as described below.
The stock system
The instrument: LI-8250 multiplexer, LI-7810 analyzer, and the flask sampling kit
The LI-8250 is an eight-port multiplexer. It routes a single trace-gas analyzer to one vessel at a time, stepping through up to eight ports in a programmed sequence. It is built for automated soil chambers in the field. The 8250-660 Flask Sampling Kit adapts the same sequencing to sealed user-built vessels, which LI-COR calls flasks. Each flux comes from a closed-transient method: for a fixed interval the analyzer and one vessel share a fixed volume of circulating air, and the gas concentration in that volume changes at a rate set by the flux.
The analyzer is an LI-7810, measuring CH₄, CO₂, and H₂O. It reports gas concentration continuously, and the multiplexer fits each flux from how that concentration changes over one observation.
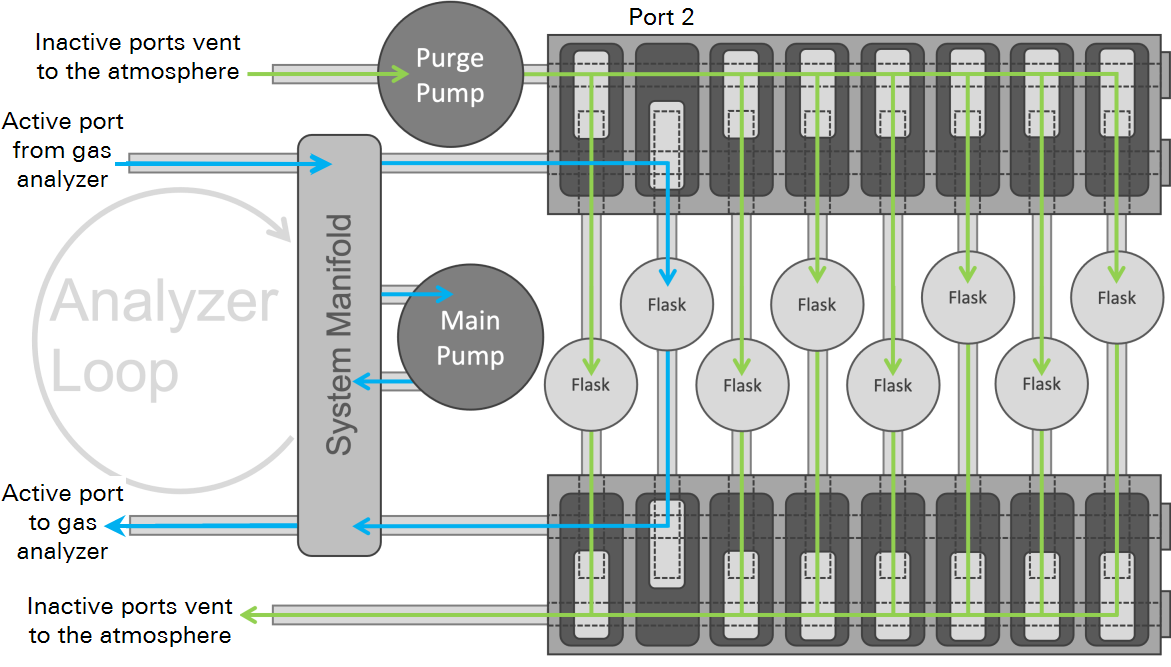
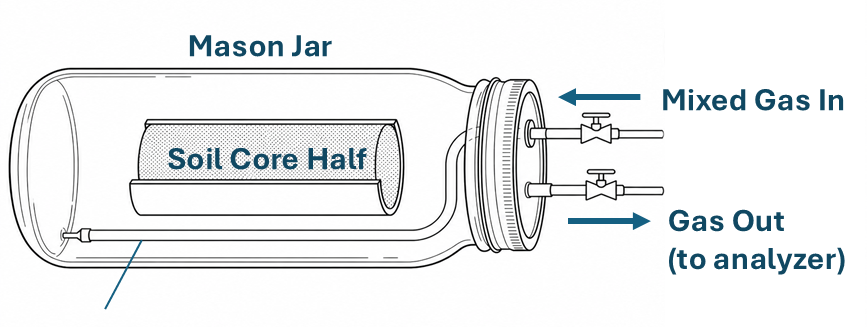
The 8250-660 Flask Sampling Kit supplies the parts that turn a jar into a port: two gas lines per vessel, one in and one out, through bulkhead fittings; a thermistor input module for air temperature; and a purge pump. Two phases alternate. During an observation, about 120 seconds here, the vessel is the active port in a closed loop with the analyzer, and the flux is fitted from this interval. Between observations the vessel is on an open loop: the purge pump pushes ambient air through it and vents that flow to the room, holding the headspace near the purge-air concentration until the next observation. The purge runs continuously. Its path through the manifold is plumbed separately from the sample path, so the vessels fill between observations with whatever the purge line carries. At the time of writing, LI-COR does not support programmatic cycling of the purge pump: it is always on, with no control over its flow rate.
The intuitive approach
Why a glove bag was unsuitable for incubation
Goal
Put the whole flask system inside an N₂-filled enclosure and let the stock instrument run unmodified.
Obstacle
Two independent failures.
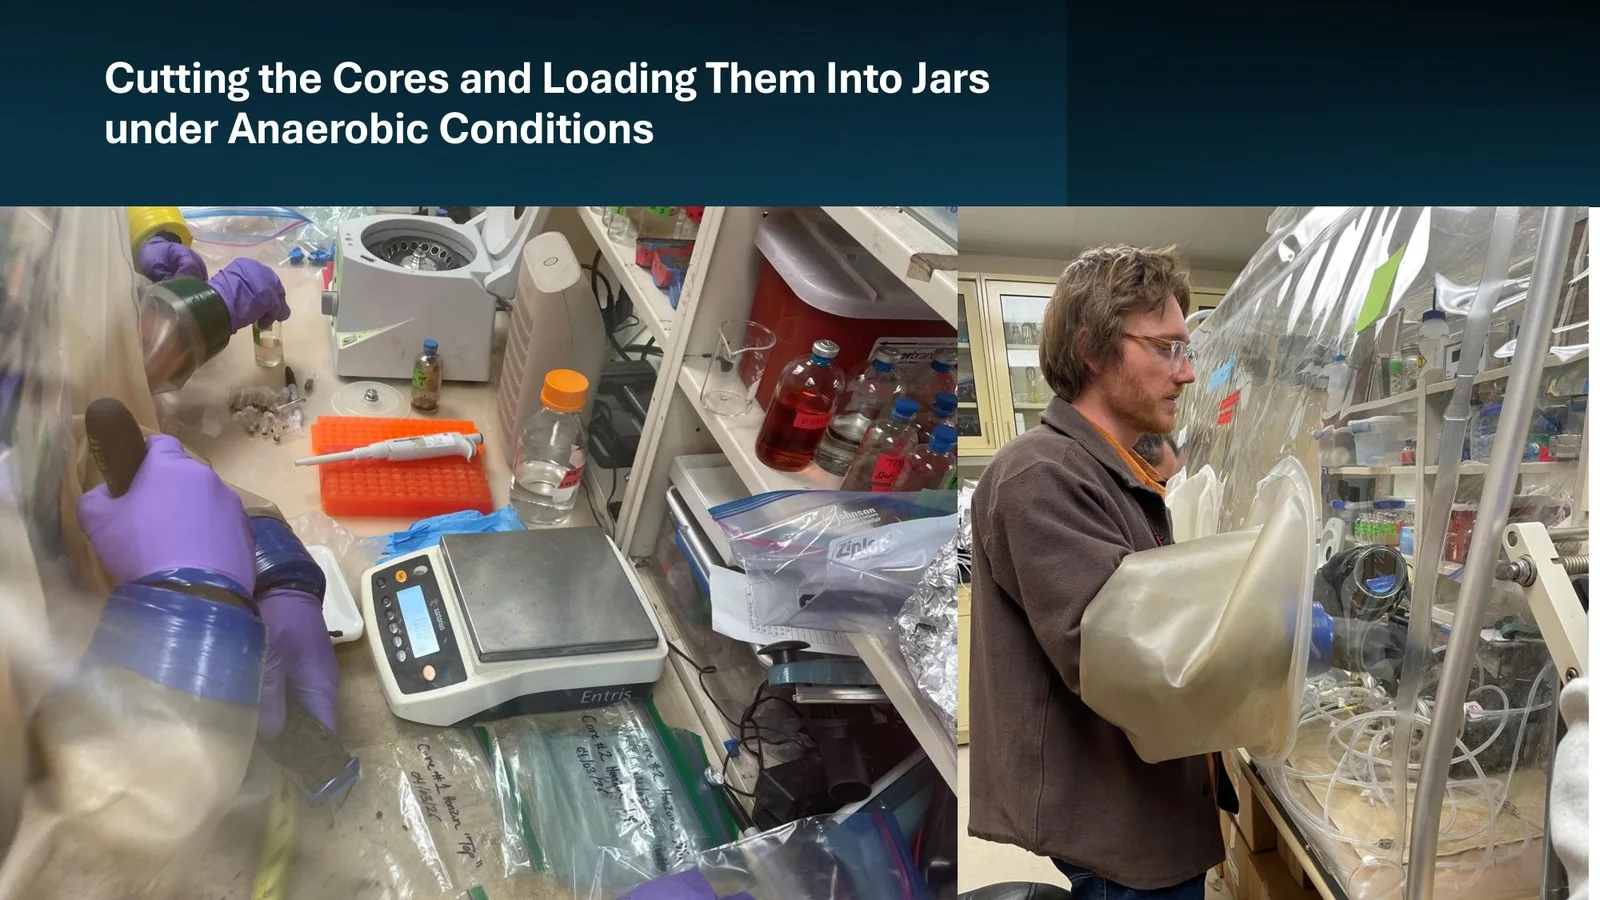
A glove bag still had a role, just not this one. The cores were cut and loaded into their jars inside an N₂-filled glove bag, so the soil never met room air during preparation. The same enclosure could not host the multi-day incubation and its running instrument, for two independent reasons, either one fatal.
The first is the analyzer. The LI-7810 conditions its own optical baseline against ambient atmosphere, and sealing it inside an O₂-free bag removes that reference and throws off the instrument’s readings.
The second is the purge loop. The flask kit is not a closed system: between observations each flask runs as an open, continuously purged loop that exhausts by design. Put an open flow-through instrument inside a sealed bag and the bag becomes the exhaust reservoir. Within hours the accumulated CH₄ and CO₂ feed back into every flask. To fix that you would need automated purging of the enclosure, or exhaust routed out of the bag, plus airtight pass-throughs for the gas and communication lines running from the multiplexer to the analyzer, which itself would have to sit outside the bag at ambient conditions.
The modification
Replacing the purge pump with a mixed-gas cylinder
Goal
Deliver an O₂-free headspace to eight flasks without enclosing anything.
Obstacle
The purge pump draws room air, and its duty cycle is not user-programmable.
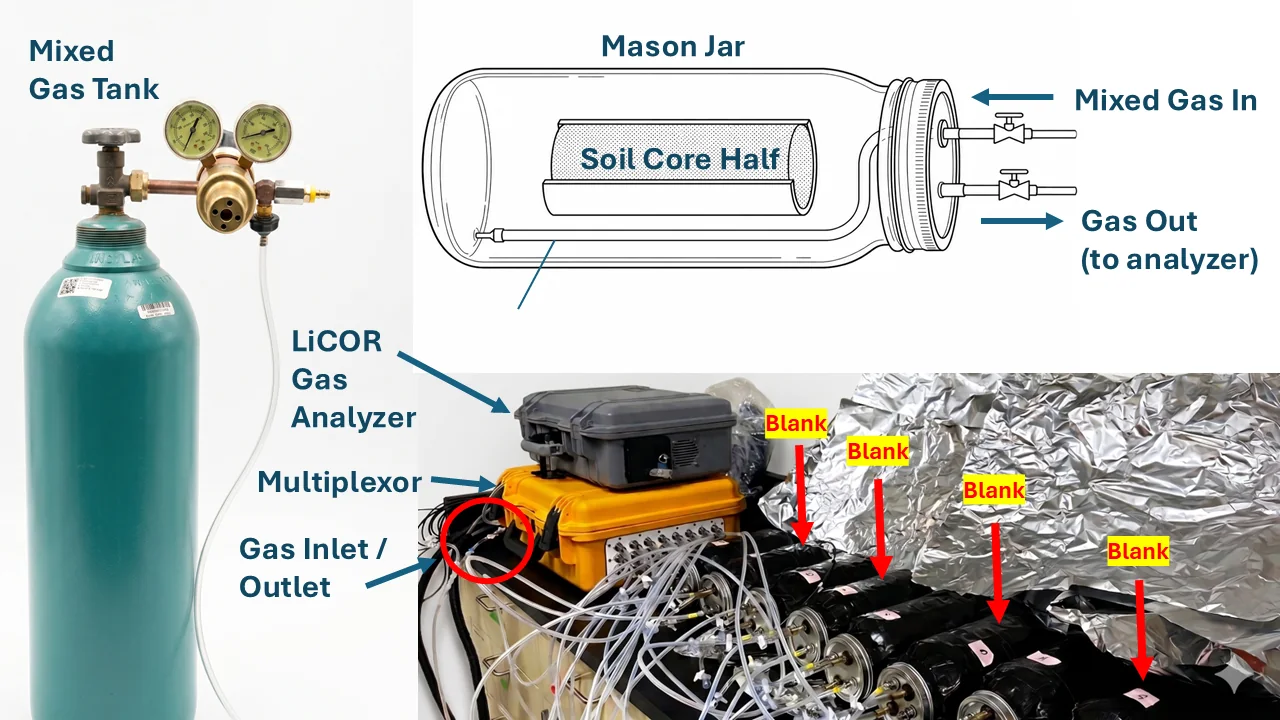
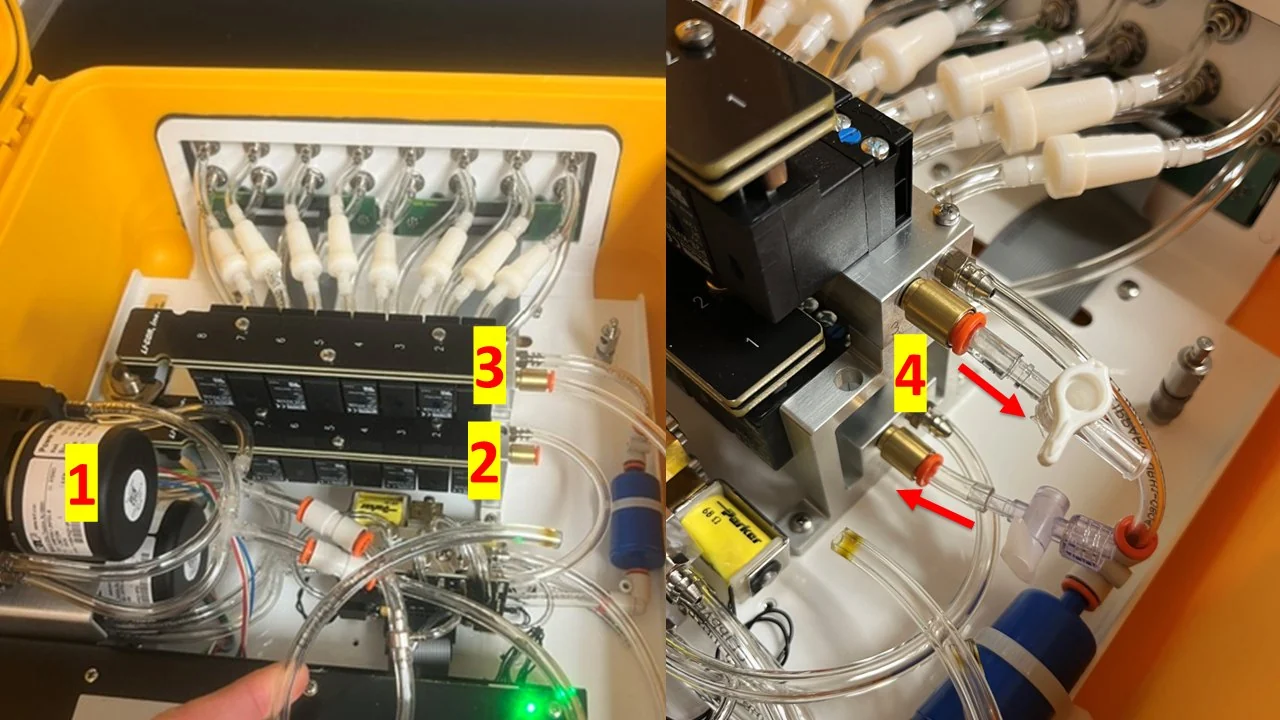
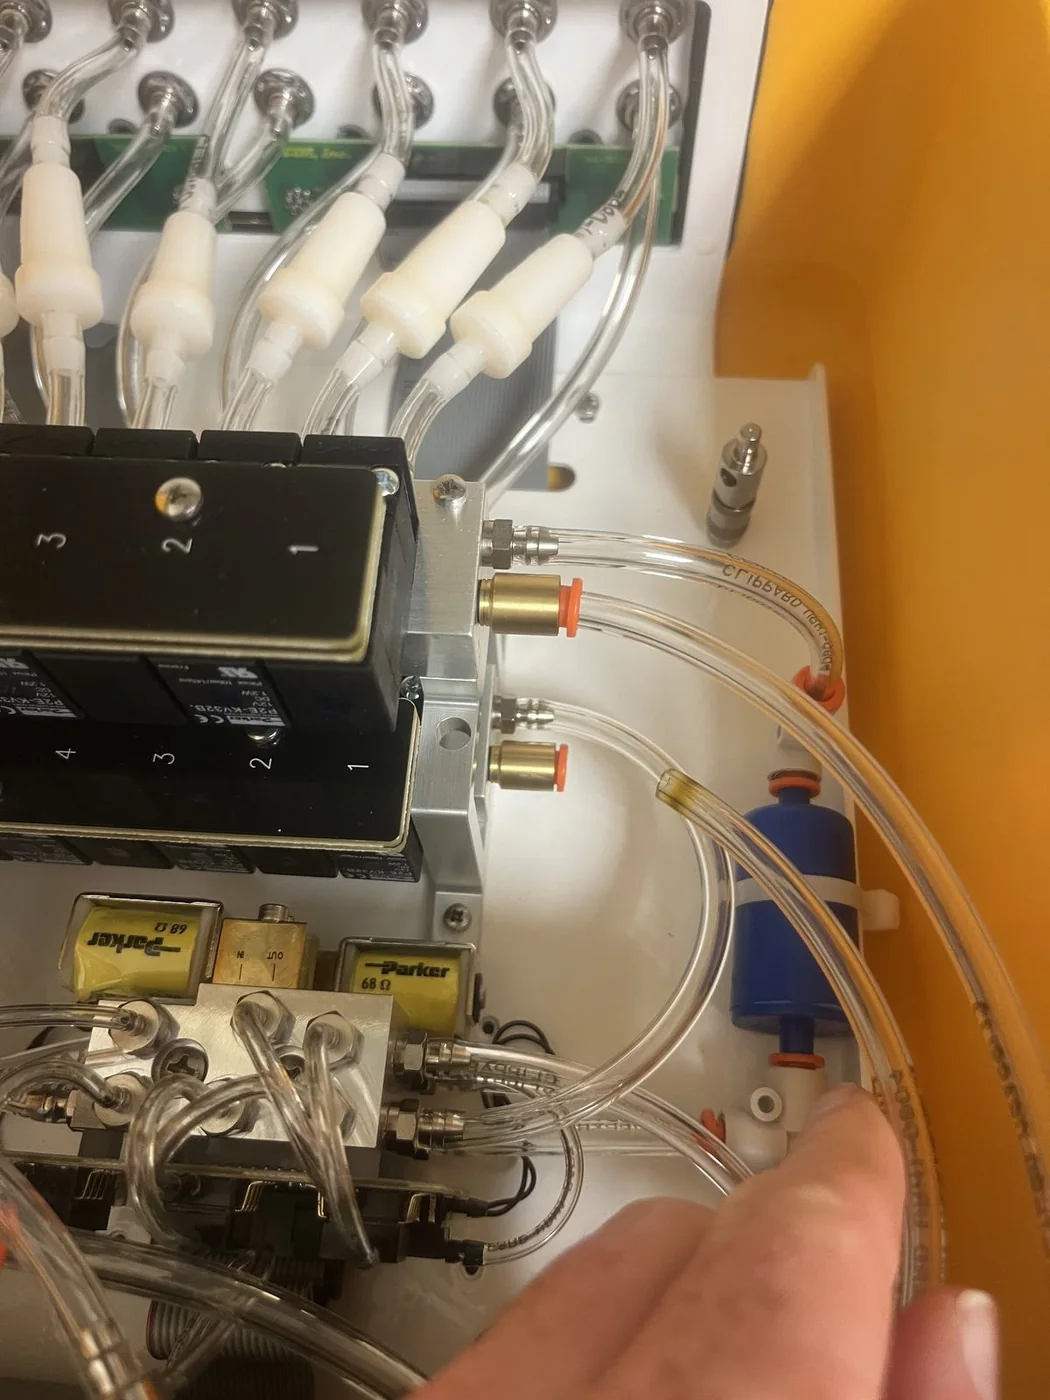
The flasks are already being flushed continuously, so the atmosphere in them is whatever the purge line delivers. After the pre-incubation leak testing was complete, we removed the kit’s purge pump entirely and connected a regulated N₂-based mixed-gas cylinder directly to the multiplexer’s purge-air ports. Cylinder pressure now drives flow through the manifold and out to the jars in place of the pump. Every other function of the instrument runs stock: valve sequencing, the closed-transient observation, and the flux computation.
The alternative we rejected, and why
Continuous purging is expensive in gas. The obvious economy is to duty-cycle it: flush hard before each observation, then idle. Physically this should work, because a flux is a rate of change over a 120-second window rather than an absolute concentration, so the headspace does not need to be swept entirely and constantly between every observation. We could not accomplish this: the purge pump’s operation is not exposed to the user in the LI-8250’s configuration, so there is no way to schedule it. Continuous flow was the only mode available to us. It means mixed gas from the cylinder is always moving through the system, but it has one advantage: methane and carbon dioxide never build up in the flasks, so the diffusion gradient of methane out of the soil is not impaired by artificially high headspace concentrations.
Flow design
Flow split and headspace turnover across eight jars
Total intake was set to 0.5 L min⁻¹ of mixed gas, split across eight 2 L jars, nominally 0.0625 L min⁻¹ each. At that per-jar rate the headspace turnover time constant (τ = V/Q) is about 30 minutes, so the ≈77-minute measurement cadence spans roughly 2.5 turnovers and renews well over 90% of each headspace between successive observations. Each observation therefore starts from the imposed anoxic baseline rather than from the tail of the previous one.
Inline flow meters were installed on both the intake and the exhaust, so total delivered flow could be read against total return rather than inferred. The exhaust was deliberately restricted to hold the jars slightly above ambient pressure. That slight restriction equalises the flow through each jar and ensures that no O₂ enters through any undetected leak.
| Run duration | Cycle period | Observations / core | Intake flow | Lab temperature | Loss per observation |
|---|---|---|---|---|---|
| 92.4 h | 77.3 min | 71 | 0.5 L min⁻¹ | 20.3 ± 0.4 °C | <0.05 % |
The sequence, and what the blanks are for
Ports 1–8 were sampled in order, alternating cores and empty jars: cores on 1, 3, 5, 7 and blanks on 2, 4, 6, 8. Each port received a 10-second pre-purge followed by a 120-second observation, so eight ports occupy 1,040 s of active sampling; a one-hour inter-cycle delay brings the full period to 77.3 minutes.
The alternation means core observations on ports 3, 5, and 7 immediately follow blank observations on ports 2, 4, and 6, which flush the analyzer subsample loop with the same mixed gas the cores see. Port 1 follows blank port 8 across the one-hour delay, and the very first port-1 observation of the run has no preceding blank at all. Blanks therefore bracket the core measurements regularly, with that one exception, and give a running system-background and carryover check.
Field lessons
Delivery-tube placement and dry-mass correction
1. Point the gas at the back of the jar
The purge inlet does not simply open into the headspace. Inside each jar it terminates in a delivery tube that carries the incoming stream to the rear of the vessel, behind the core, so the flush travels the length of the jar instead of striking the exposed soil face. A continuous 0.0625 L min⁻¹ jet aimed at a core for four days would dry it. Over 92.4 hours the cores lost 7.7–8.7 g of water (mean 8.2 g).
That gram range is narrow, but as a fraction of each core’s initial water content it spans 7.3% to 22.1%. Starting water content ranged from 38.7 to 109.2 g, so roughly 8 g is 22% of the driest core and 7% of the wettest: the variation is in the starting condition, not in the drying.
2. The mass you enter at acquisition is not the mass you need
Mass-based flux is Fg = f / m, and the acquisition software requires a mass per port before the run begins. The mass that belongs in that equation is oven-dry soil mass, which cannot be obtained non-destructively. The cores also arrived inside a plastic sheath that was required to hold them intact, which prevented a clean initial weighing of the soil alone.
So we entered a deliberate placeholder: 100.0 g on every port, cores and blanks alike. The run therefore recorded fluxes normalised to a nominal mass rather than a measured one. At the end of the incubation each core was reweighed intact to quantify water loss, then destructively dried to obtain its true oven-dry mass of 83.1, 87.3, 105.7, and 128.7 g. Because Fg scales as 1/m, each core’s entire flux time series could then be rescaled exactly, by the ratio of 100 g to its measured dry mass.
The normalisation was recovered after the measurement and applied to every point in the series. The correction is exact, with bookkeeping the only caveat. Published to four decimal places the per-core factors (0.7773, 1.2032, 0.9463, 1.1452) reproduce 100 g to within ±0.002 g. Carry the unrounded ratio, not the printed factor.
Validation
Leak testing and methane tracer recovery
An anoxic incubation in glass jars invites one obvious objection: the jars leak. We checked in three independent ways.
First, the multiplexer’s own built-in leak test, run per the manufacturer’s procedure with a rotating open purge port so each port was exercised in turn. Second, a pressure check: with the purge pump still installed, the exhaust was restricted to hold the sealed system slightly above ambient, and every fitting was checked for outward leakage with soap solution. Fittings were sealed with vacuum grease. Third, a methane tracer test. Before soil loading, four empty jars were each spiked with 30 mL of a 10% v/v CH₄ standard, nominally ≈1,500 ppm. Measured initial headspace was 1,541 ± 39 ppm across the four jars, about 103% recovery. Concentrations were then tracked for roughly 69 hours.
CH₄ declined by first-order loss through the seals, with half-lives ranging from about 24 to about 124 hours across jars, or 0.6–2.9% per hour. That is under 0.05% loss across a single 120-second observation, and about 2% over a full 77-minute cycle.
We describe this as verification and recovery rather than calibration. The analyzer’s calibration is LI-COR’s, and nothing here modifies it.
What we could not resolve
Two loss mechanisms are in play: diffusion through the seals, and loss associated with the sampling events themselves. Two closed-loop tests separate them. In Test 3 the headspace was spiked with CH₄ and sampled repeatedly with the purge pump off, so every sampling event removes a roughly fixed fraction of the remaining headspace CH₄. Test 4 repeated the spike but inserted about four-hour quiescent holds with no sampling. The concentration drop across each hold isolates the diffusive loss rate, since sampling contributes nothing during a hold.
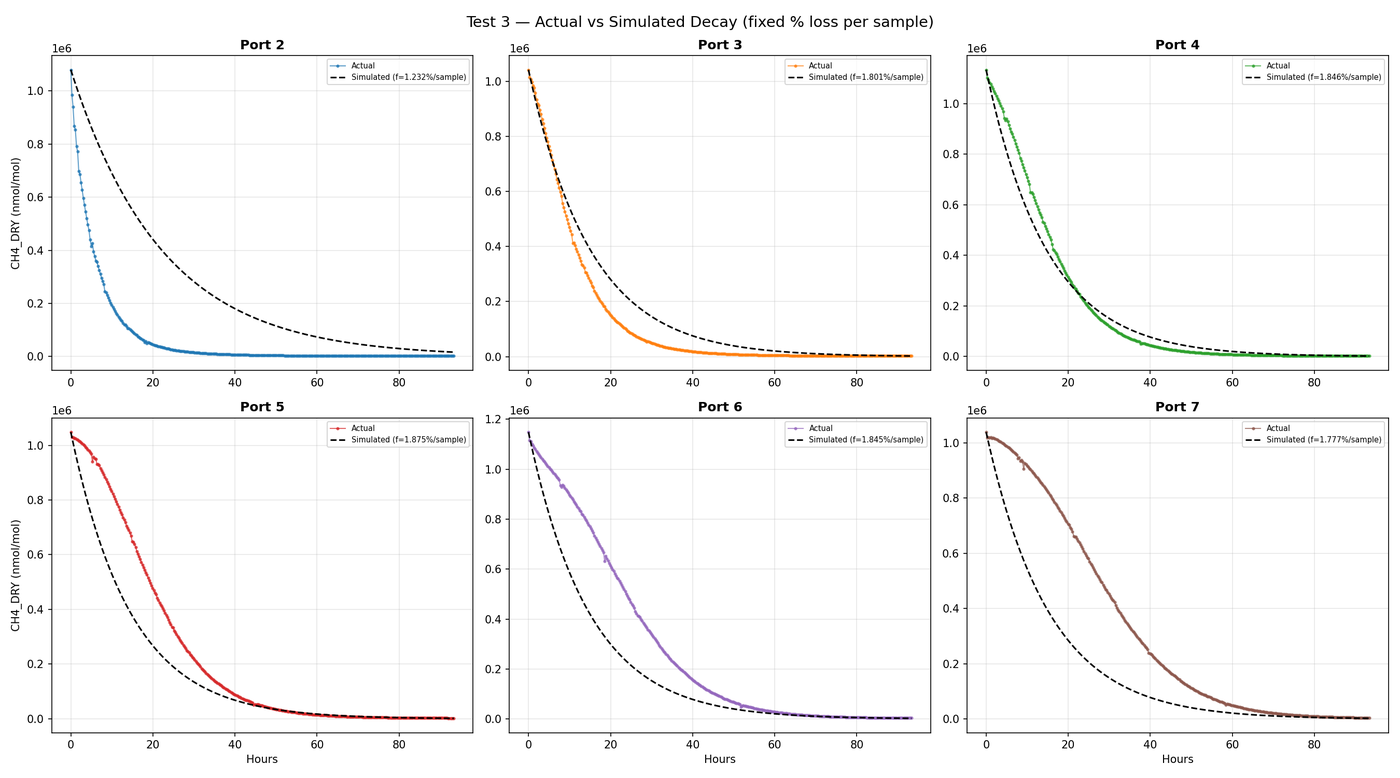
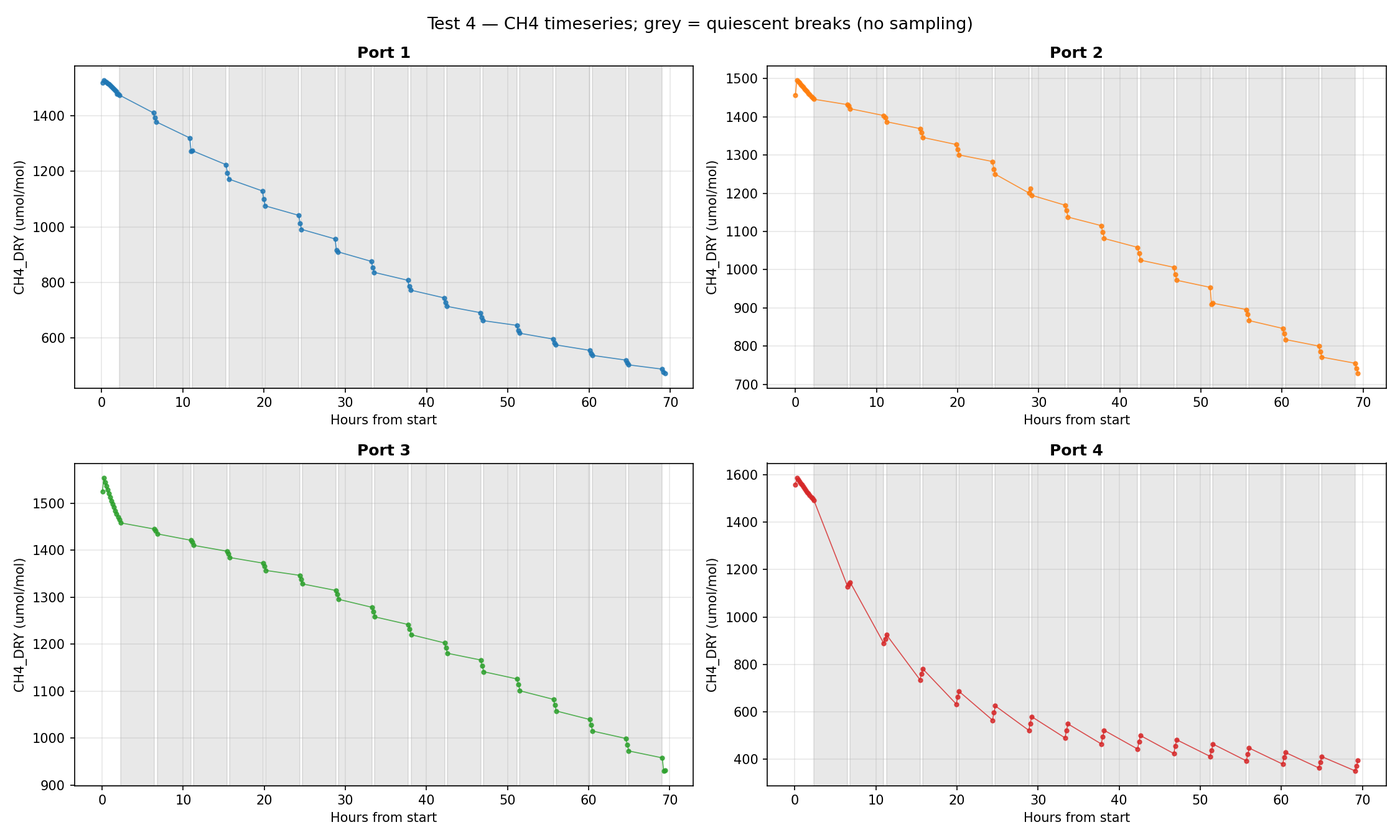
Earlier open-purge tests quantified per-sample dilution of roughly 1% per sample, correlated with sampling order, but those tests could not settle the sealed case. In the sealed test the four-hour static gaps show continuous loss (ports 1–3 at 0.18–1.1% h⁻¹), which diffusion explains and sampling cannot. One jar was plainly worse than the rest, at 3.8–6.7% h⁻¹, and inside sampling clusters its concentration sometimes rose, making any event-associated term for it uninterpretable.
This test was meant to check the jar seals, but in the end it is of limited use: diffusive loss operates on a timescale irrelevant to the 120-second observation, and samples are never taken in rapid succession. During the incubation the system is also flushed continuously, which removes any real concern about losing headspace methane over the course of an observation. The test was informative about how methane diffuses through our flasks when held at artificially high concentration gradients, but it has no real bearing on measurement accuracy.
Result
Field methane sinks became sources under imposed anoxia
Four intact core halves were incubated: three collected in September 2025 under dry-season conditions, and one collected in June 2025 from a wetter position.
The three September cores changed from net CH₄ uptake in the field to net CH₄ production under imposed anoxia. The June core (Core 4, OBJ1A) was already a net source in the field, showed the smallest directional response, and of the four cores carried the highest gravimetric moisture. That pattern is consistent with greater O₂ limitation at the June position, but field O₂ was not measured.
Because the incubation imposes anoxia, it is not surprising that Cores 1 to 3, the drier cores, went from net consumers in the field flux measurements to net producers in the incubation (table below). What gives me confidence that the setup works as expected is Core 4. It was the odd one out, the wettest of the bunch at around 60% water holding capacity, and its positive field methane flux in the table reflects that. When Core 4 was placed under imposed anoxia its methane flux rose only slightly, which implies the incubation measurements are consistent with those obtained in situ in the field using an open-chamber LI-COR gas flux analyzer at the soil surface.
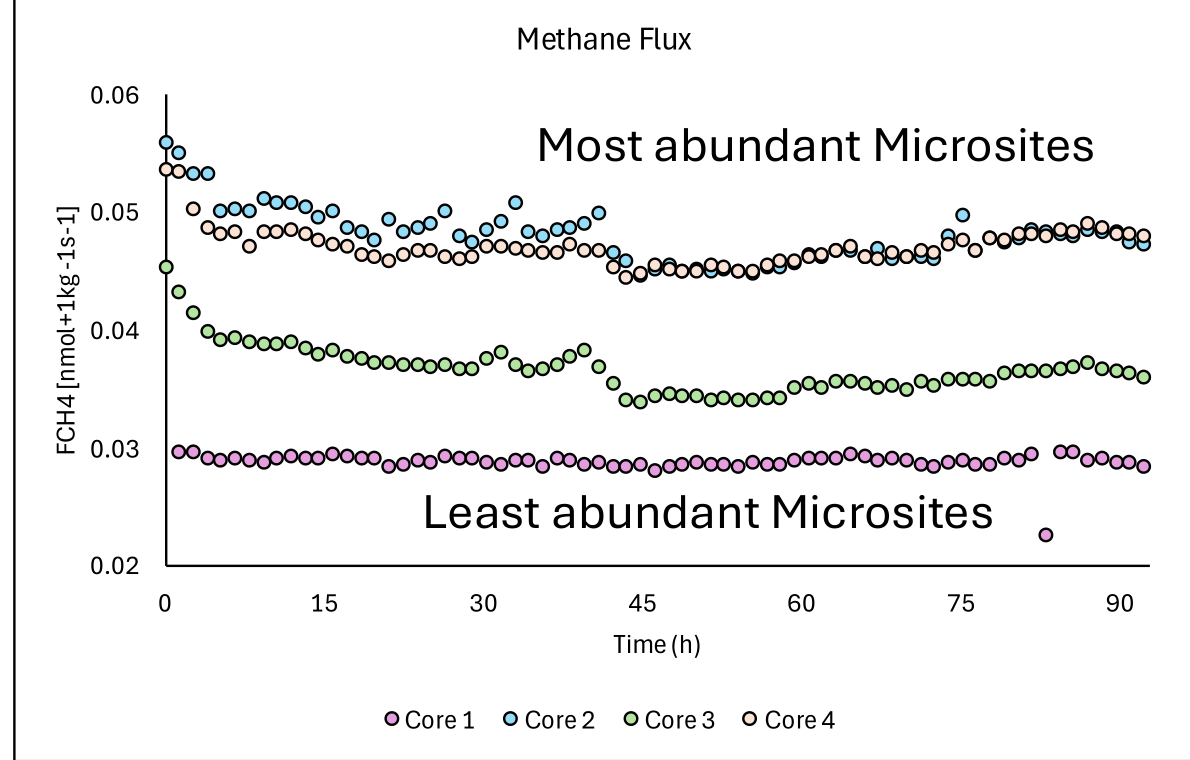
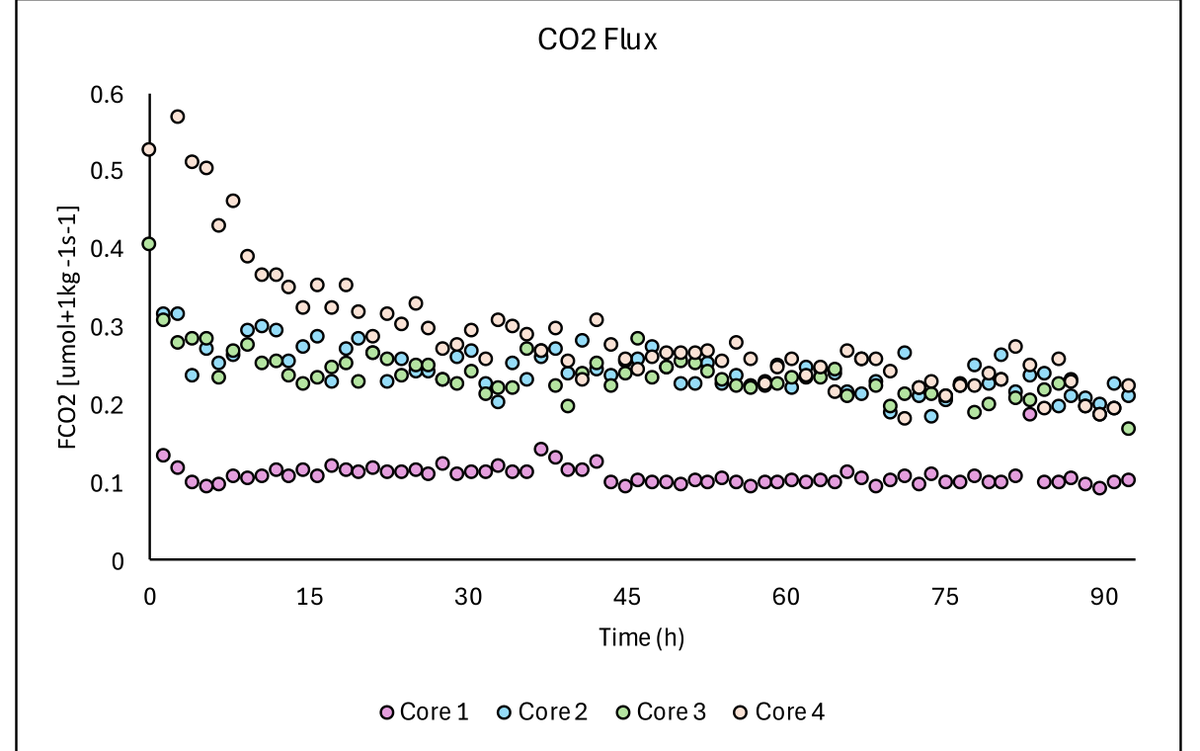
Field versus incubation flux, direction only
| Sample | Avg FCH4 (nmol m⁻² s⁻¹), field | Avg FCO2 (µmol m⁻² s⁻¹), field | CH₄ flux (nmol kg⁻¹ s⁻¹), incubation >60 h | CO₂ flux (µmol kg⁻¹ s⁻¹), incubation >60 h |
|---|---|---|---|---|
| OBJ1A – Core 4 (June) | 0.03755 | 0.656 | 0.0474 | 0.2310 |
| OBJ2G – Core 3 | -0.37144 | 1.37217 | 0.0360 | 0.2161 |
| OBJ2H – Core 2 | -0.35611 | 1.29953 | 0.0474 | 0.2237 |
| OBJ2I – Core 1 | -0.14027 | 0.91415 | 0.0288 | 0.1056 |
The cores entered the incubation frozen, and the reported means are taken over the final 25 of the 71 observations, after thawing had completed and the flux had stabilised. The full-series means over all 71 observations are also valid and are larger. They describe a different window, one that includes the thaw transient.
Limits
Limits of the method
It is a three-to-four day method. Continuous flow at 0.5 L min⁻¹ consumes roughly 30 L of gas per hour, about 720 L per day; a cylinder lasts about six days. The incoming stream is not humidified, so the cores dry progressively but modestly over 92 hours. Extending to weeks would require humidification, a larger or manifolded gas supply, and the duty-cycled purge the LI-8250 configuration does not expose.
Seal quality varies between jars and you should expect it. In tracer testing one jar leaked several times faster than the others. This does not compromise the flux measurement, but it does mean per-jar seal characterisation is worth doing rather than assuming, especially if you intend any headspace-accumulation analysis over hours.
Watch the start of the run. Cores that enter frozen produce a thaw transient that is not a soil process you want in your mean. Decide in advance how you will define the stable window, and report which window you used.
Reproduce it
Equipment and operating settings
Taxonomy: an open, flow-through anoxic incubation with closed-transient (dynamic closed, FT-NSS) flux observations, in which the between-observation purge is FT-SS-like.
Instruments and hardware
| Item | Specification | Role |
|---|---|---|
| Multiplexer | LI-COR LI-8250, s/n 82m-0561, fw 2.1.4 | Valve sequencing, purge routing, flux computation |
| Trace-gas analyzer | LI-COR LI-7810 CH₄/CO₂/H₂O, s/n tg10-01928, fw 2.3.8 | Closed-transient concentration measurement |
| Flask kit | LI-COR 8250-660 Flask Sampling Kit | Eight-flask plumbing; purge pump removed after leak testing |
| Incubation vessels | 2 L (2,000 mL) Ball Mason jars, ×8 | 4 cores (ports 1, 3, 5, 7) + 4 blanks (2, 4, 6, 8) |
| Purge gas | Compressed N₂-based mixed gas | Establishes and maintains anoxia |
| Regulator | Gas cylinder regulator | Replaces the purge pump as the driving pressure |
| Flow meters (×2) | 1 L min⁻¹ ball flow meters | Inline on intake and exhaust; balance and verify flow |
| Exhaust restrictor | One of the two flow meters | Holds slight positive internal pressure; equalises per-jar flow |
| Lid ports and valves | LI-COR Flask Sampling Kit | Gas in / gas out, both multiplexer-controlled |
| Tubing | LI-COR Flask Sampling Kit | Lengths and IDs entered into SoilFluxPro for system volume |
| Internal delivery tube | LI-COR Flask Sampling Kit | Routes purge flow to the rear of each jar |
| Sealant | Vacuum grease | Fitting seals |
| Processing software | LI-COR SoilFluxPro 5.3.1 | Linear fit, 20–120 s window |
Operating parameters (as configured)
| Parameter | Value | Note |
|---|---|---|
| Port order | 1 → 8 | Cores odd, blanks even |
| Pre-purge / observation | 10 s / 120 s | 130 s logged per port |
| Dead band | 20 s | Fit window 20–120 s, linear |
| Active sampling per cycle | 1,040 s | 8 ports × 130 s |
| Inter-cycle delay | 3,600 s | Full period 4,640 s = 77.3 min |
| Intake flow | 0.5 L min⁻¹ | ≈0.0625 L min⁻¹ per jar; τ ≈ 30 min |
| Sample volume (core ports) | 158.6 mL | Mean core volume; headspace 2,000 − 158.6 = 1,841.4 mL |
| Sample volume (blank ports) | 0.0 mL | Full 2,000 mL headspace |
| Mass entered at acquisition | 100.0 g | Placeholder on every port; corrected post hoc |
| Oven-dry masses | 83.1 / 87.3 / 105.7 / 128.7 g | Destructive, end of run |
| Thermistor | channel 7 | Single channel shared by all ports |
| Run | 92.4 h | 30 Mar – 3 Apr 2026; 71 observations per core |
The instrument configuration file is the most precise form of this protocol: config_FINALRUN_20260330.mux, importable through the LI-8250’s WiFi web interface. If you want to replicate the timing exactly, take the file rather than the table.
The exported configuration declares a cycle duration of 01:18:48. The configured blocks sum to 4,640 s (77.3 min), and the same unexplained 88-second discrepancy appears in an earlier configuration file that also contains no such block. We publish the value the configuration actually specifies.
Manufacturer documentation. LI-COR Biosciences, Using the LI-8250 Multiplexer (document 984-19441); Measuring Gas Fluxes in a Flask System with the LI-8250 Multiplexer, 8250-660 Flask Sampling Kit application note (document 979-19810); Using Custom Chambers with the LI-8250 Multiplexer application note (document 979-19673). Instrument and flask-kit facts, and the flask-kit flow diagram, are drawn from these.
Method developed at SLAC National Accelerator Laboratory for the Lab for Oxidation–Reduction Chemistry of Anoxic Microsites. Cores collected at Slate River, Colorado. Questions and corrections are welcome, especially if you are attempting this on an LI-8250 or LI-8150.