Class exercise · Introduction to LiDAR · FUSION / LDV
Reading a forest in a LiDAR point cloud
A few hundred thousand loose points, and no forest in them until you know what to look at.
What it was
Airborne LiDAR doesn't arrive as a forest. It arrives as a tile of unclassified returns, and the exercise was to work one of those tiles in FUSION, the USDA Forest Service's LiDAR toolkit, until the structure in it became legible. Load it, look at it, cut plots out of it, measure something real off it.
How it worked
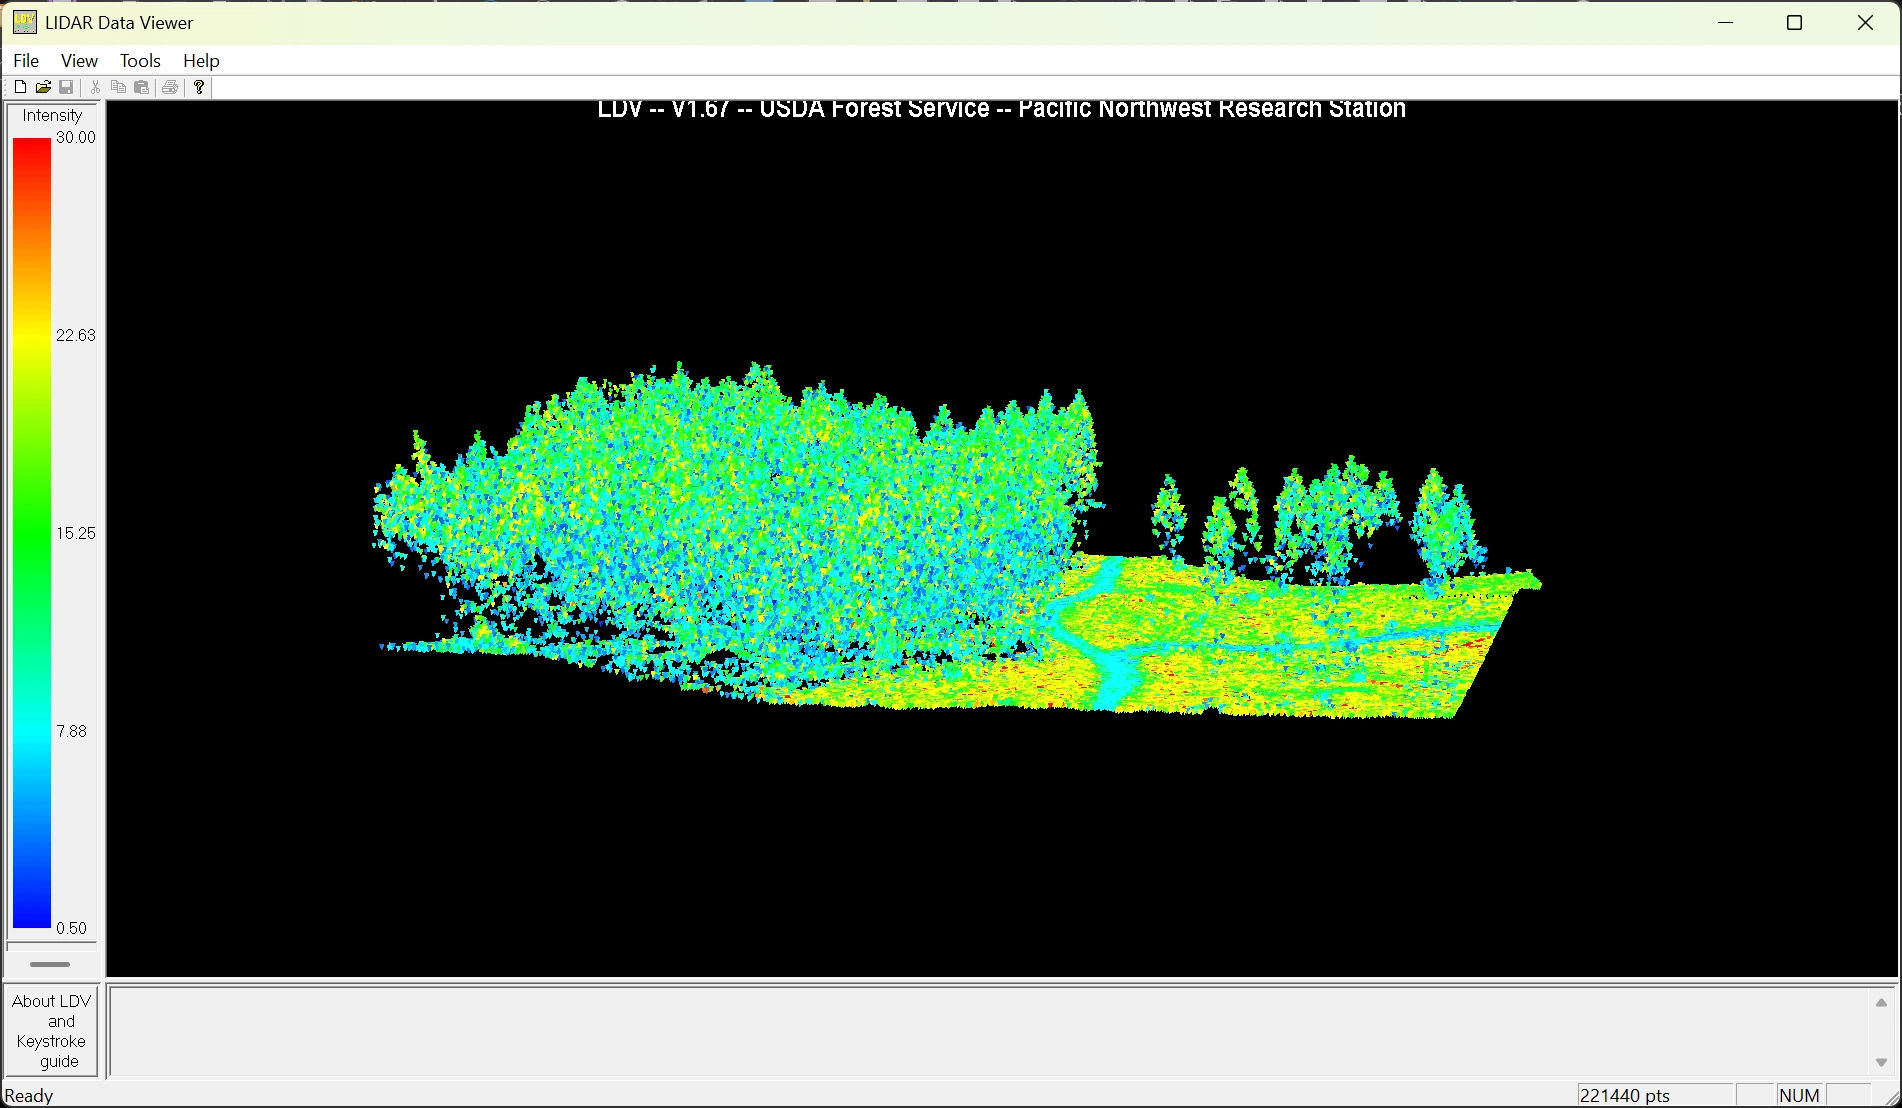
I loaded the raw cloud in FUSION's LIDAR Data Viewer alongside its bare-earth surface, so the ground was there as a reference rather than as guesswork. Then I stretched the return intensity to pull canopy away from open ground. Sample plots came out of the tile through a command-line batch file rather than by clicking, which is the part that would scale to a whole survey. Individual tree heights I measured off the cloud by hand.
What I learned
Intensity does more than I expected. Canopy and open ground pull apart on return intensity alone, before any point classification runs, which means a lot of the reading you want is already sitting in the raw returns. It's the closest thing in the coursework to the active side of remote sensing, where you're working with the signal the sensor sent rather than the light that happened to be there.
Figure