Class assignment · Introduction to GIS · ArcGIS Pro
Digitizing green space for a stormwater project
The layers the planners needed didn't exist, so the exercise was to draw them.
What it was
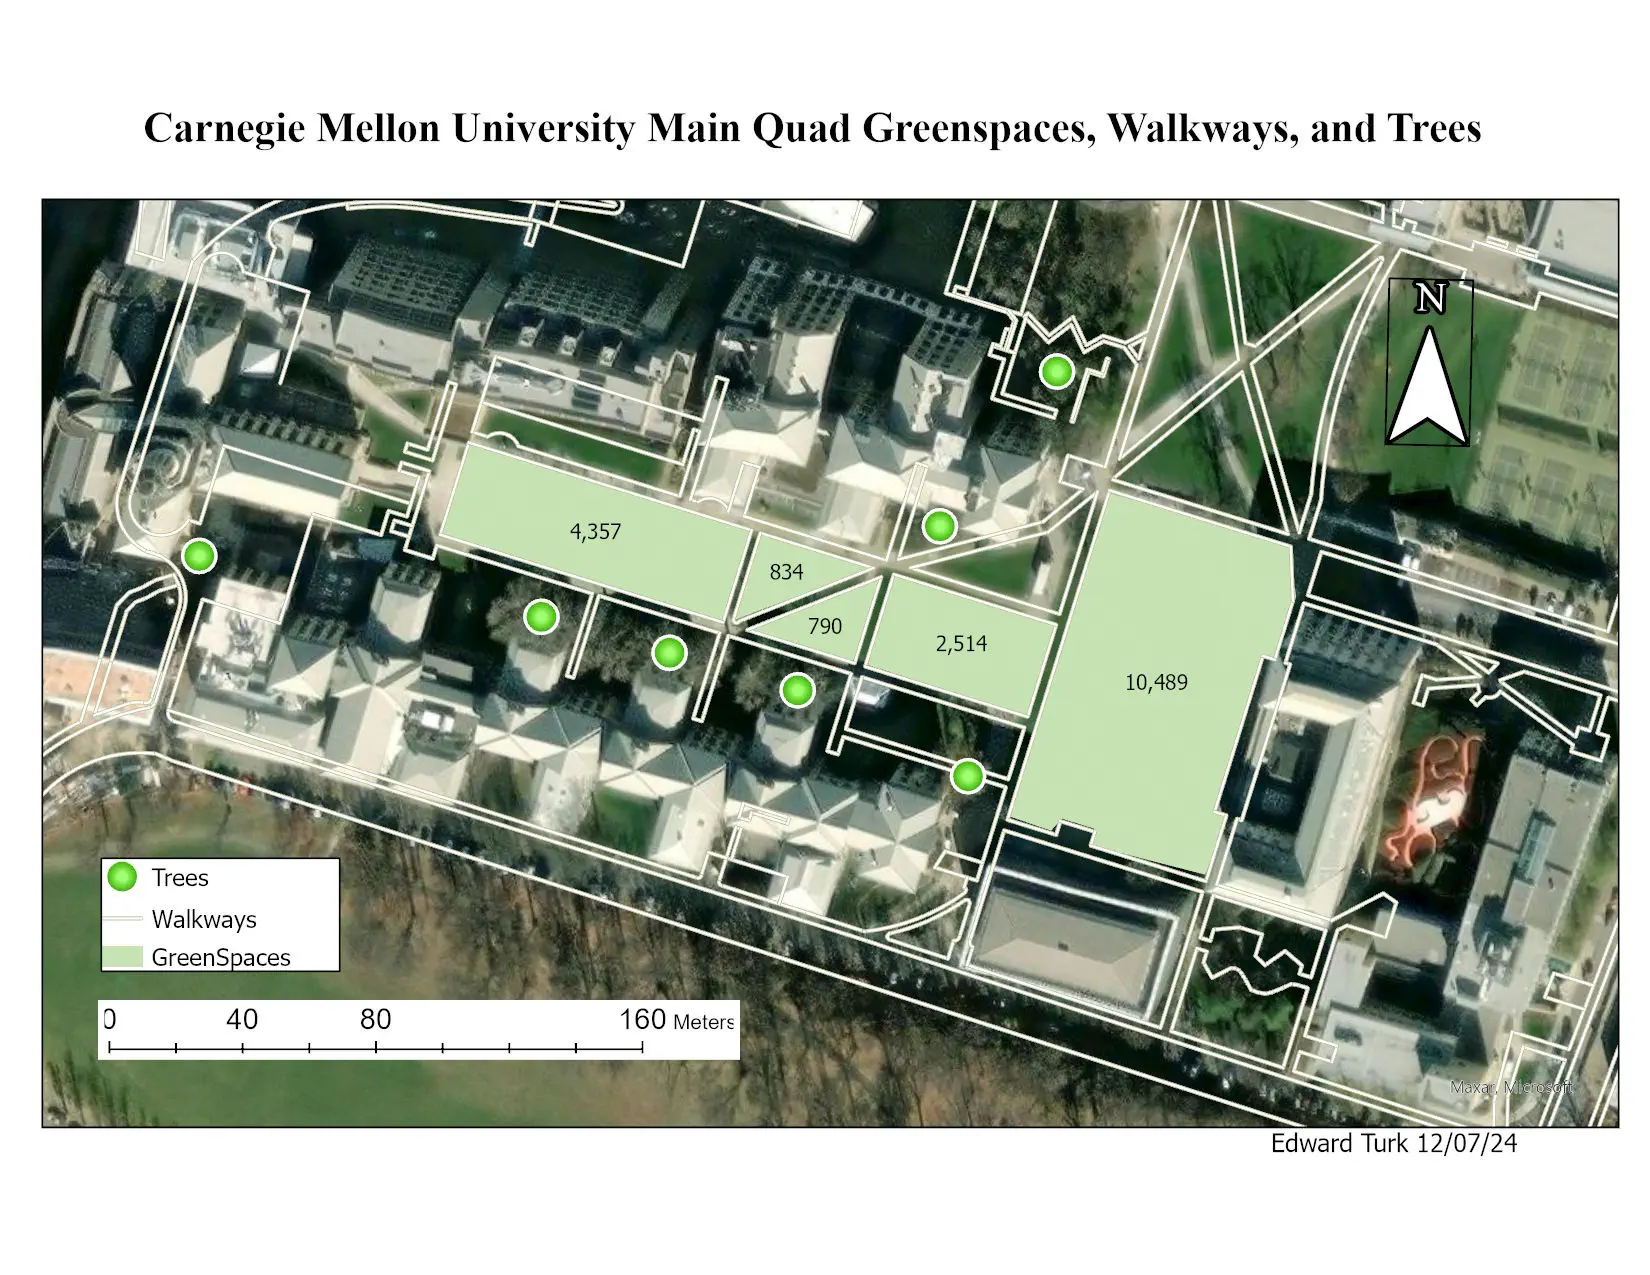
A campus stormwater scenario. Underground detention tanks going in beneath a university mall, and a planning team that needs to know how much permeable surface is up there and where the trees are. None of that existed as data. The aerial is the Carnegie Mellon University main quad, which is the site the exercise uses. The course is USF's.
How it worked
I digitized straight off the aerial imagery in ArcGIS Pro. Green spaces became polygons, walkways became lines, individual trees became points, all drawn by hand at a working scale close enough to see where the grass actually stops. ArcGIS then calculated the area of each polygon and I labeled every one with its own figure. Drawn December 2024.
What I learned
It's a small exercise. It's also the genuinely manual part of GIS, deciding where a lawn ends and staying consistent about that across a dozen features. The first polygon is easy. The tenth one is where you find out whether the rule you started with was actually a rule.
Figure